If you run a foundry, a forge or a fabrication shop in Europe, nobody needs to tell you that electricity is expensive. The European Commission's own Steel and Metals Action Plan acknowledges that EU power costs two to three times what US competitors pay, and that energy, which used to account for around 17% of steel production costs and 40% for aluminium, reached up to 80% at the height of the 2022 crisis. Prices have eased since, but not by much: in the first half of 2026, Eurostat put the average price for industrial customers using 500 to 1,999 MWh a year at €0.190 per kWh in Belgium, €0.207 in Poland and €0.225 in Italy, excluding VAT and recoverable taxes.
At the same time, the regulatory clock is ticking. The first deadline for mandatory energy audits under the recast Energy Efficiency Directive passed on 11 October 2026, and the deadline for certified energy management systems at the largest consumers falls in October 2027.
This guide maps where electricity actually goes in metal processing, which measures have documented savings, and where power quality, so often ignored, quietly eats into the results.
How much energy metal processing uses
Europe's metal industry is electrifying fast. In 2024, 44.6% of the EU's 129.6 million tonnes of crude steel came from electric arc furnaces, according to EUROFER. Further down the value chain, energy intensity varies enormously, which is why benchmarks matter. The EU's best available techniques conclusions for smitheries and foundries, adopted in December 2024, set these ranges for specific energy consumption:
| Process | Benchmark |
|---|---|
| Induction melting, cast iron | 600–1,200 kWh per tonne of liquid metal |
| Steel foundries | 600–1,200 kWh per tonne of liquid metal |
| Cupola melting | 900–1,750 kWh per tonne of liquid metal |
| Forging plants | 1,700–6,500 kWh per tonne of feedstock (indicative) |
If your plant sits at the top of these ranges, there is something to find. If it sits well below, check the measurement before celebrating.
The weight of energy in the cost base also varies by sub-sector and country. Using Eurostat's structural business statistics for 2019, the last full year before the energy crisis, energy purchases amounted to 3.1% of production value for basic metals in Belgium, 4.8% in Germany, 4.9% in France and 7.7% in Poland. For foundries the figures were 4.0%, 5.0%, 4.1% and 4.6%. Belgian industrial electricity prices rose 62% between the second half of 2019 and the second half of 2025, so today's shares are considerably higher.
Where the electricity goes
Electric motors dominate. According to the International Energy Agency, motor systems account for around 70% of industrial electricity in the EU, and 72% globally in 2023. Pumps, fans, compressors, conveyors, presses, rolling and drawing machines all count.
The detailed split depends on the process. The US manufacturing energy consumption survey, the most granular public dataset of its kind, gives a useful picture:
| End use | Fabricated metal products | Foundries |
|---|---|---|
| Machine drives (motors) | 46% | 35% |
| Process heating | 15% | 35% |
| HVAC | 14% | 9% |
| Lighting | 8% | 6% |
Two things stand out. In fabrication almost half the electricity goes into motors, and in foundries melting and motors split the bill roughly evenly. And in both, HVAC and lighting together take between 15% and 22% of the electricity, more than most plant managers would guess.
The measures that pay back first
Motors and drives
The IEA estimates that the best motors save 4–5% of motor energy, while optimising the whole system (sizing, drives, transmissions and controls) saves another 15–25%, so a cost-effective improvement of 20–30% is typical. Energy accounts for over 95% of a motor's life-cycle cost, which is why the purchase price should rarely decide the choice. EU rules already set the floor: IE3 has been mandatory since July 2021 for motors from 0.75 to 1,000 kW, and IE4 since July 2023 for motors from 75 to 200 kW.
Variable-speed drives deliver the largest single gains on fans and pumps because of the affinity laws: a fan running at 80% speed draws only about half of its full-speed power.
Compressed air
Compressed air is one of the most expensive forms of energy on site, and one of the leakiest. The US Department of Energy's sourcebook notes that leaks can sometimes waste 20–30% of a compressor's output, while a well-maintained system keeps losses below 5–10%. There is a second prize: 80–93% of the electricity a compressor uses ends up as heat, and 50–90% of that heat can be recovered for space or process heating.
Furnace practice
The best available techniques conclusions list measures that cost little beyond discipline: keep furnace lids closed, minimise holding time, keep a liquid heel, melt at full power rather than idling, and manage peak demand. For induction furnaces, they also favour medium-frequency (250 Hz) designs over 50 Hz ones.
Waste heat recovery
The Steel and Metals Action Plan identifies metals as the sector with the highest waste-heat recovery potential in EU industry. Furnace off-gases and induction furnace cooling water are the usual sources, along with the compressor heat mentioned above.
Power quality: dips, harmonics and reactive power
This is where many efficiency programmes leak without anyone noticing.
Voltage dips trip variable-speed drives through their DC-bus undervoltage protection. A study by the Belgian laboratory Laborelec, presented at the CIRED conference, found that such outages can reduce the savings from drives or eliminate them altogether. A European survey by the Leonardo Power Quality Initiative put the cost of poor power quality at more than €150 billion a year in the EU-25, with industry bearing over 90% of it. Treat that as an order of magnitude rather than a precise figure, but the direction is clear.
Harmonics come from rectifiers, drives and, above all, induction furnaces. With 6-pulse rectifiers, current distortion at an induction furnace is around 21.5%; with 12-pulse designs it falls to about 6%. Harmonic currents overheat cables, transformers and motors, and eddy-current losses in transformer windings grow with the square of both the harmonic current and its order.
Reactive power comes with every motor and transformer. Raising the power factor from 0.70 to 0.95 cuts the current by 26% and the resistive losses in cables and transformers by 46%, and in tariffs that charge for reactive energy it removes that line from the bill as well.
A static VAR generator with active harmonic filtering deals with harmonics, reactive power and phase imbalance in one unit, while a supercapacitor-based micro-interruption compensator keeps drives and controls running through dips and short interruptions of up to one second at full load.
Voltage optimisation: where it fits, and where it doesn't
Voltage optimisation lowers and stabilises the supply voltage, which reduces consumption in loads that respond to voltage. The measurement guide of the Sustainable Energy Authority of Ireland is a useful reality check: plants dominated by variable-speed drives, LED lighting and thermostatically controlled heaters gain little or nothing, and fixed-speed motors save only when they are oversized or part-loaded. It also reminds engineers that a 10% voltage reduction cuts induction-motor torque by about 19%.
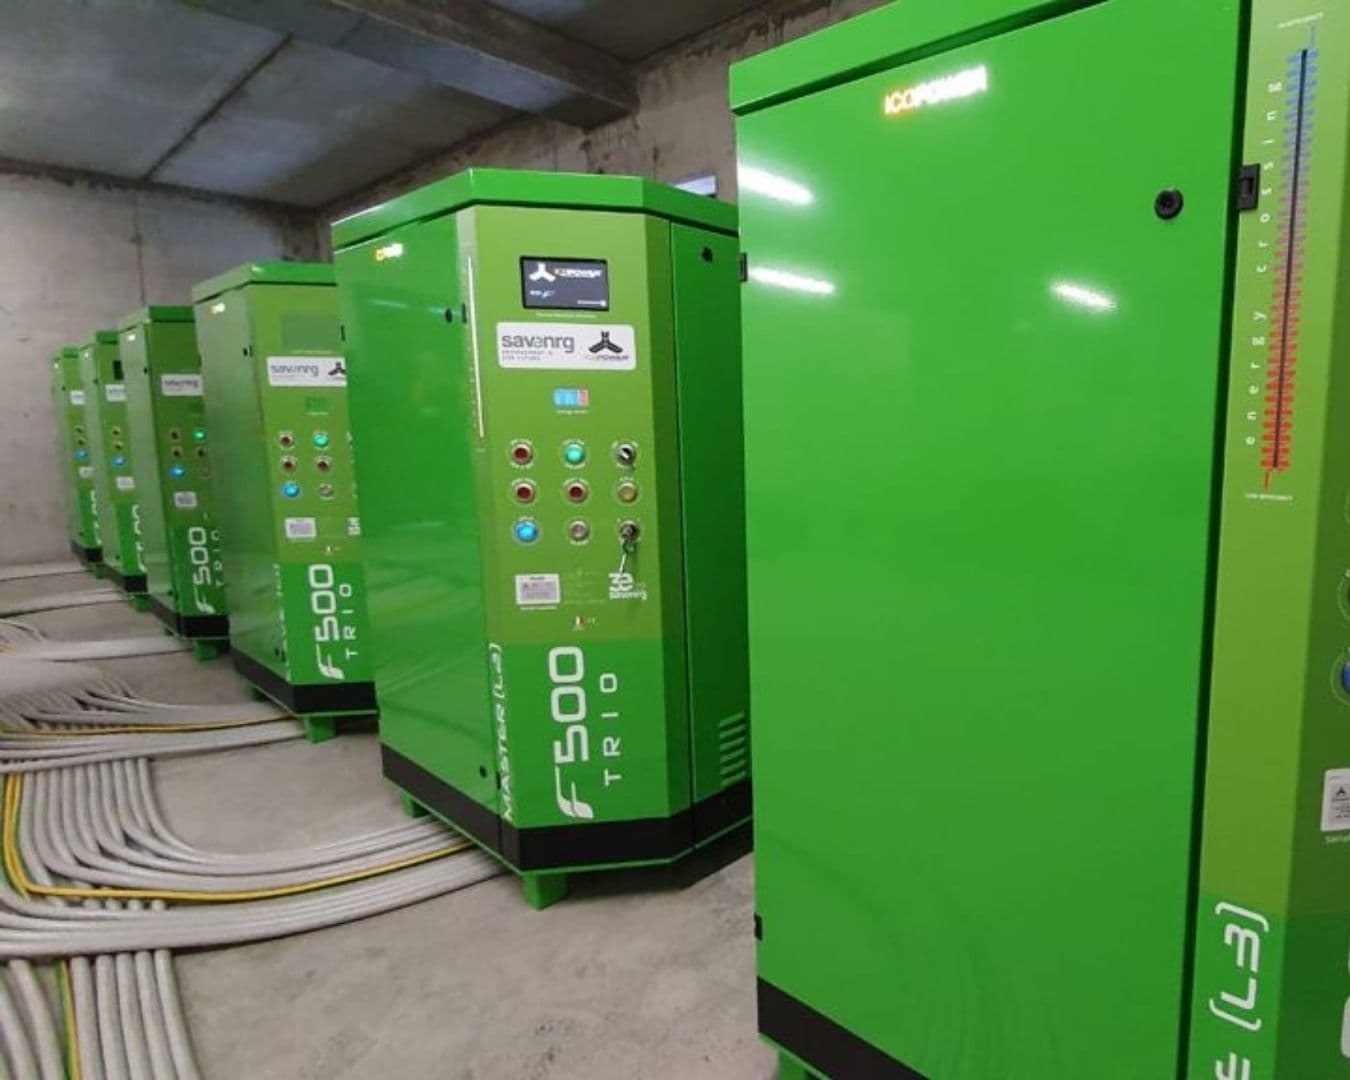
That is why we survey before we promise. Where the load mix supports it, our ICO-F voltage optimisation comes with a 5–9% saving written into the contract and measured under IPMVP. Among our documented installations, a steel plant saved 6.3% with a payback of 2.8 years, and a wire-drawing mill 11%. Where it does not fit, we say so. The same logic applies far outside heavy industry, as we showed in our guide to voltage optimisation in hotels.
| Measure | What the evidence says | Source |
|---|---|---|
| High-efficiency motors and system optimisation | 20–30% of motor-system energy | IEA |
| Variable-speed drives on fans and pumps | About half the power at 80% speed | Affinity laws |
| Compressed-air leak repair | Losses from as much as 20–30% down to 5–10% of output | US DOE |
| Compressor heat recovery | 50–90% of the heat recoverable | US DOE |
| Power factor from 0.70 to 0.95 | 26% less current, 46% lower cable and transformer losses | Calculation |
| Voltage optimisation | Depends on the load mix; nothing on drives, LEDs and thermostatic loads | SEAI |
A worked example: a 1,800 MWh fabrication plant
Numbers become more convincing when they are your own, so here is an illustration you can redo with your data. Take a metal fabrication plant buying 1,800 MWh of electricity a year. At the Belgian average for its consumption band, €0.190 per kWh, the bill comes to about €342,000 a year.
- If its consumption follows the survey split above, about 46%, or 830 MWh, goes into motors. A 20% improvement in the motor systems, the lower end of the IEA range, saves around 165 MWh, worth roughly €31,000 a year.
- Suppose the compressors use 180 MWh a year and leaks waste a quarter of their output. Bringing the losses down to 8% saves around 30 MWh, or close to €6,000 a year, before any heat recovery.
- If the power factor sits around 0.70, compensation cuts the current by a quarter. That frees transformer capacity for the next machine and, where reactive energy is billed, removes the charge.
Together, the first two items alone are worth about €37,000 a year, more than a tenth of the bill, and neither depends on a breakthrough technology. What they depend on is measurement: without sub-metering, nobody can say whether the motor share in your plant is 46% or 30%, or whether your compressors leak a quarter of their output or a tenth.
The regulatory clock: EED audits, ISO 50001 and CBAM
Under Article 11 of the recast Energy Efficiency Directive (EU) 2023/1791:
- Companies using more than 85 TJ a year (about 23.6 GWh, averaged over three years, all energy carriers) must have a certified energy management system, such as ISO 50001, in place by 11 October 2027.
- Companies using more than 10 TJ a year (about 2.78 GWh) that do not have one had to carry out an energy audit by 11 October 2026, and must repeat it at least every four years. They must also draw up an action plan and report on its implementation in their annual report.
Member states had until 11 October 2025 to transpose these rules, and the national details vary, so check with your national energy agency what applies to your sites.
For steel and aluminium there is a second driver. The Carbon Border Adjustment Mechanism entered its definitive phase on 1 January 2026, with certificate sales starting in February 2027, while free allocation of ETS allowances to these sectors is being phased out over the coming years. Every MWh saved now also lowers the carbon cost embedded in your products.
A 90-day plan for a metalworking plant
- Weeks 1–2: meter. Pull 15-minute data from the utility meter and install temporary sub-metering on the largest motor systems, the compressor room and the furnaces.
- Weeks 2–4: power quality. Log voltage, harmonics, power factor and dips at the main incomer for at least two weeks.
- Weeks 3–6: quick wins. Run a compressed-air leak survey, tighten furnace practice and switch off idle equipment.
- Weeks 6–10: business cases. Size drives, compensation, heat recovery and voltage optimisation against measured data, not catalogue figures.
- Weeks 10–13: decide and contract. Prioritise by payback and by the EED and ISO 50001 deadlines, and write the measurement method into every contract.
If you would like a second pair of eyes on your meter data or power-quality logs, talk to our engineers. For results from comparable plants, see our case studies.